Yelp Itineraries
I. Prologue
The Brief
Our project this time was to research, plan, and test an itinerary feature for Yelp’s smartphone app. Yelp wanted to become the go-to place for travel planning, something that would leverage its extensive location review database and meet its end goal of increased user engagement. To this purpose it had two tasks it wanted users to be able to do:
Allow users to create itineraries
Allow users to document their experiences
The Context
This was my first taste of a team project in this UX course. Being in a team meant that people would be more able to leverage their strengths to support other members’ weaker points, however it would also mean a greater need for communication and cooperation. In addition, this time around we were not given anything besides the brief so our approach would be up to us.
II. Discover
Setting Up Collaborative Systems
When I work on projects, I create systems of organization and project management to keep myself on track. I did the same this time, immediately set up the following modes of collaboration:
Google DriveI created a set of folders for each phase of the project and each folder, as well as important subsections were placed into a table of contents so as to be easily accessible. I usually use a system of notebooks and tags in my Evernote to organize my projects, but used Google Drive in this situation since team members had not used Evernote before.
SlackSlack allowed us to easily communicate. Like Google Drive, this app was required by our program and everyone already used it.
Trello + Elegantt pluginTrello is a task management system that organizes tasks into cards. The Elegantt plugin visualizes these tasks in a Gantt chart. My team members had not used this app before and there was no substitute that they had used so I gave them a quick primer on its use.

Trello with the Elegantt plugin creates Gantt charts out of your Trello tasks.
Competitor Analyses
As part of the initial research, we looked into competitor apps to understand how trip planning is normally done. We conducted a variety of analyses on what features existed and how they functioned, as well as how well or badly they did what they did. This information would inform and inspire the design of our Yelp itinerary feature.


Heuristic Evaluation allowed us to compare competitors’ levels of UX.

After picking a few favorite apps, we looked into the flow of these apps to understand the various ways a current user would achieve a task. This flow was made in Sketch.
User Research
Next, we wanted to understand the potential users of itinerary apps. From this research we would eventually create personas and then be able to understand the problem which we would solve in our design of the trip feature.
Screener Surveys
We started by creating a screener survey with a variety of questions designed to identify people who traveled often, either for work or for leisure. We also asked questions regarding itinerary use and app-usage among others, before ending with a request for their name and a contact info if they would be willing to do a longer, followup interview.
Interviews
From TODO number of screener results, we identified a number of people who fit our criteria for further interviewing and reached out to them. In total we interviewed 11 people of a variety of travel and itinerary-making habits. We conducted interviews in-person, over the phone, and over video chat resulting in a large amount of data we would synthesize next.
From interviews, we realized that were were many more competitors than we had expected; users planned trips through unexpected media such as Google documents, Excel, and even simply taking screenshots on one’s phone. In contrast, Yelp’s app had numerous ways to access the same features within the app. More ways of accessing and doing something is typically good for user freedom and control, up to a point. Beyond that point, it can become confusing, which we had a hunch that Yelp’s app was. Later on, we would discover that this was indeed the case. This, along with the realization that most apps were very simple, made us conclude that we should attempt to make a companion app instead of putting the feature into the already overstuffed Yelp app.
Data Synthesis
From TODO number of screener results, we identified a number of people who fit our criteria for further interviewing and reached out to them. In total we interviewed 11 people of a variety of travel and itinerary-making habits. We conducted interviews in-person, over the phone, and over video chat resulting in a large amount of data we would synthesize next.
Data synthesis is often conducted by writing out each finding on a post-it note and then sticking them on a wall, grouping them in what is called an affinity diagram to show clusters of related findings. We digitized this method by porting it to Trello as writing out all the data on post-its was a tedious (and often illegible) process.
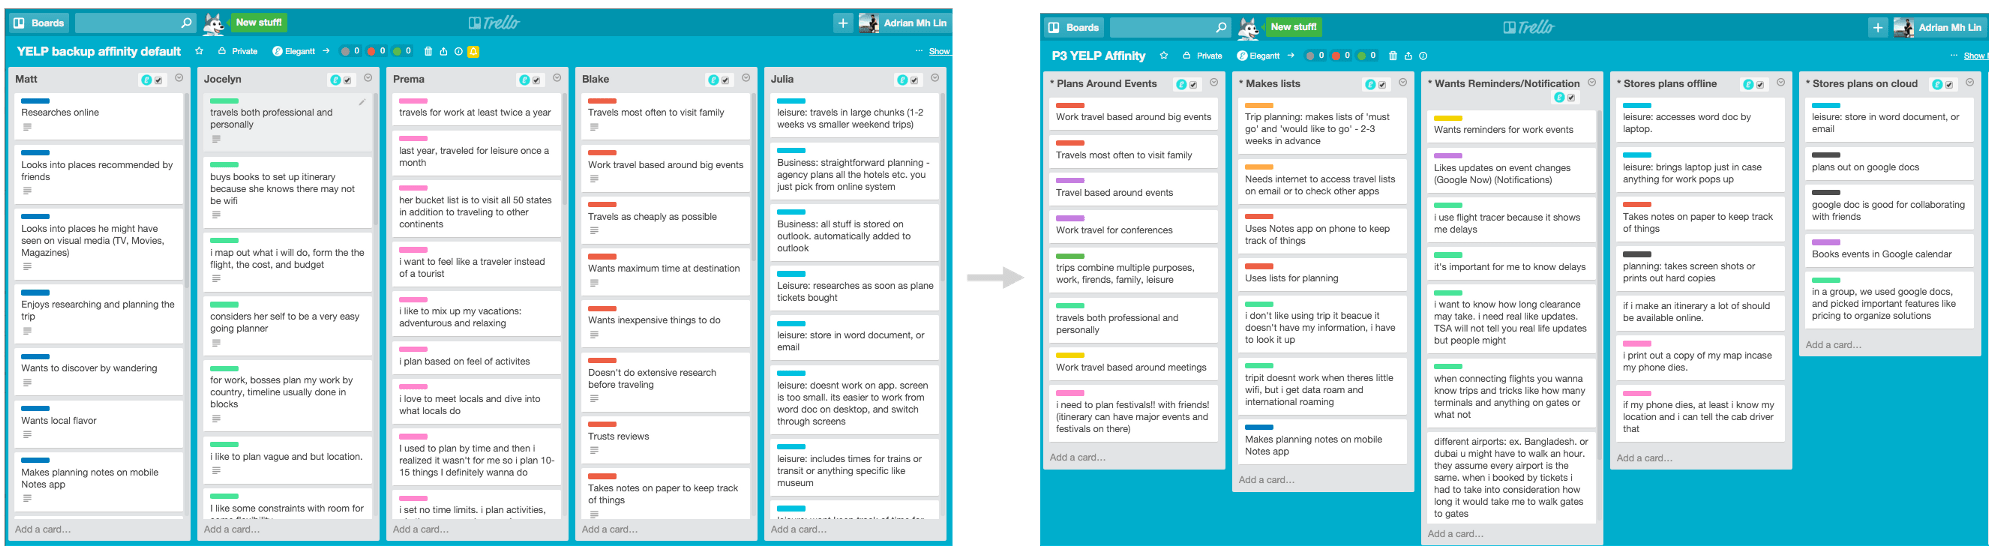
With Trello, we first created lists for each interviewee and labeled it visually with different colors. Next we grouped these cards into new lists of similar sentiments. Thus, we could visually see which sentiments were more common and which were less so, helping us create our personas.
We reused the method from my first project, organizing data points on Trello. However, the problem of spatial freedom was more pronounced in this project, being much larger in scale than the first, i.e., while it was easy to make cards, and move them between lists, lists could not be moved further apart or nested, meaning larger groupings would not be possible as they would with a traditional physical affinity diagram. In addition, lists visually max out at a certain distance, so any extra cards would be hidden, only accessible via scrolling. This made it difficult to see cluster sizes beyond a certain quantity.
Luckily, I was able to fix both of these problems of larger, nested groupings, and quantity visualization via Mindnode. Here, I listed each of the top-level findings and branched out from these to the sub-level findings, fixing the nesting problem. To fix the quantity visualization problem, I simply changed the text’s font-size with a formula to visually represent findings with larger and smaller quantities of data points. With this mind map, we were able to identify the most important results.

With Mindnode, sub-nodes, spatial composition, and font-size showed meta-data about the points, i.e. which findings were most important and common.
III. Define
Personas
Armed with synthesized data, we began to piece together personas. We dug into the results to understand their needs, motivations, and paint points and eventually identified three profiles, which became the personas listed below.
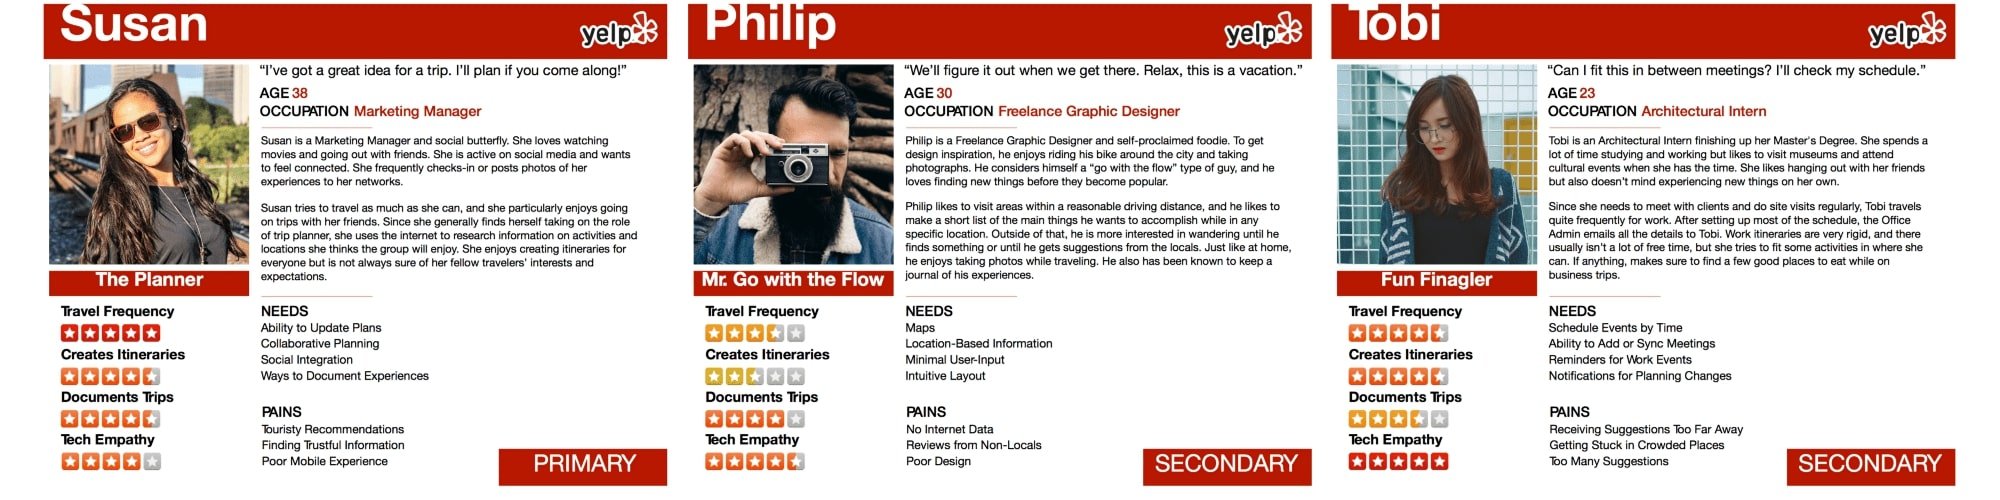
From our research we identified three personas, and decided to focus mainly on Susan and Philip.
We decided to focus primarily on Susan and Philip as these were two personas that traveled often for leisure, whereas Tobi traveled mostly for work; we discovered work travelers rarely made itineraries for work as this was often provided for them meaning our primary focus would be on leisure. The main difference between Susan and Philip then, is the former likes planning and makes detailed itineraries before the trip, while the latter may have a few points of interest planned out but add things later while there. In addition, users mentioned that they had problems collaborating on group trips and this should be a major focus.
Most users had a variety or combination of the planning methods:
Chronological: People planned trips by time, listing out events and their durations on a calendar or timeline-like manner.
Categorical: People planned trips by listing them out by categories, picking from the list later on based on what was appropriate at that time.
Geographical: People planned trips by location, often selecting a number of locations in the same area so as to be more efficient.
While we knew the feature would be an itinerary feature as well as a documenting feature, the exact method that the feature would be shaped by the personas needs.
Feature Prioritization
Based on our personas as well as an evaluation of our progress and remaining time, we prioritized areas our app would address via the MoSCoW method and placed it in the following table.

The MoSCoW method (Must, Should, Could, Won’t) allowed us to prioritize our time on the testing and development of features.
IV. Develop
With the personas and problems identified, we set out to develop the solution. We had learned of user stories and job stories in class and this knowledge helped us in ideating features to solve users’ needs and help them achieve their goals.
Object-oriented UX
Because two out of three of us in my group had a web technology background, we moved towards a object-oriented UX approach to developing the screens and features. Object-oriented UX in a nutshell is a UX process that brings nouns to the forefront instead of allowing only actions to take the spotlight. For example, instead of illustrating multiple flows that a user may take, an object-oriented approach may instead identify the nouns, or objects, the flow occurs through, and design while keeping in mind the nature of these nouns. What happens is that there is a more consolidated and concise design process as multiple flows are discovered to happen between a smaller set of nouns, instead of in isolation. In addition, this reduces communication difficulties between designers and developers, as programming languages have been moving toward object-orientation and databases are designed in the same manner.
With this in mind, we identified the major objects in this app feature that would need to be built. Keep in mind, an object may not be a feature, although they may often afford for features. These objects were travelers, trips, trip-events, and journals. In addition, the relationship between these objects was as follows.
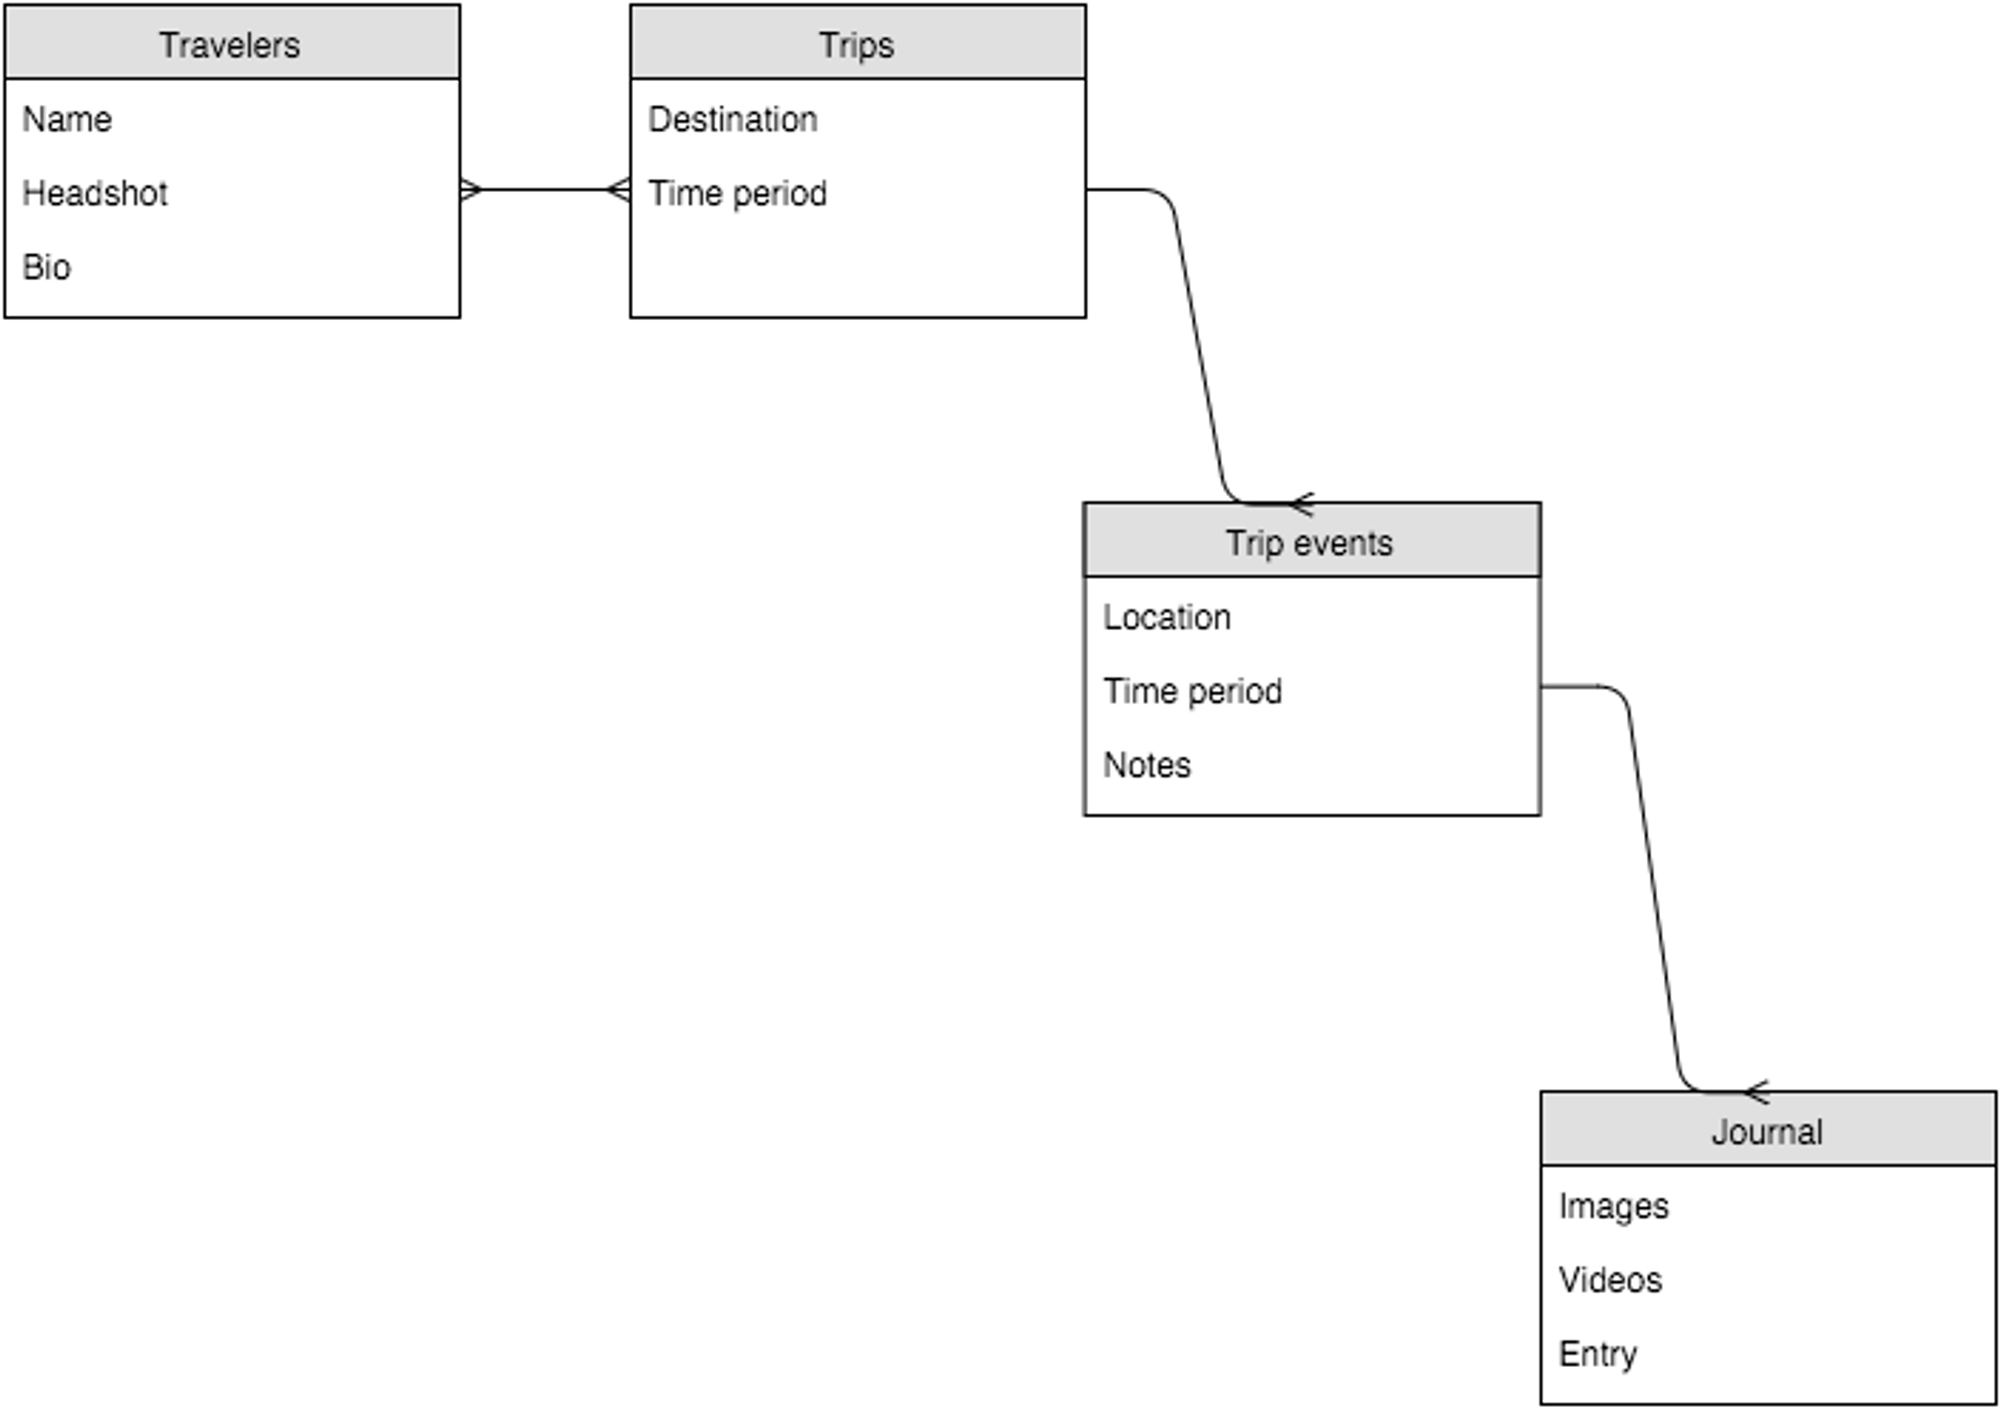
Borrowing from web development, the various objects are illustrated here in an adapted entity-relationship diagram (ERD). The object title is in grey while listed below are various attributes of that object, i.e. trips have a destination and a time period that it would last. Also, forked paths mean that the preceding object contains many of the subsequent objects. Certain ERD conventions irrelevant in illustrating the relationship here have been omitted.
Wireframe, prototype, test, repeat
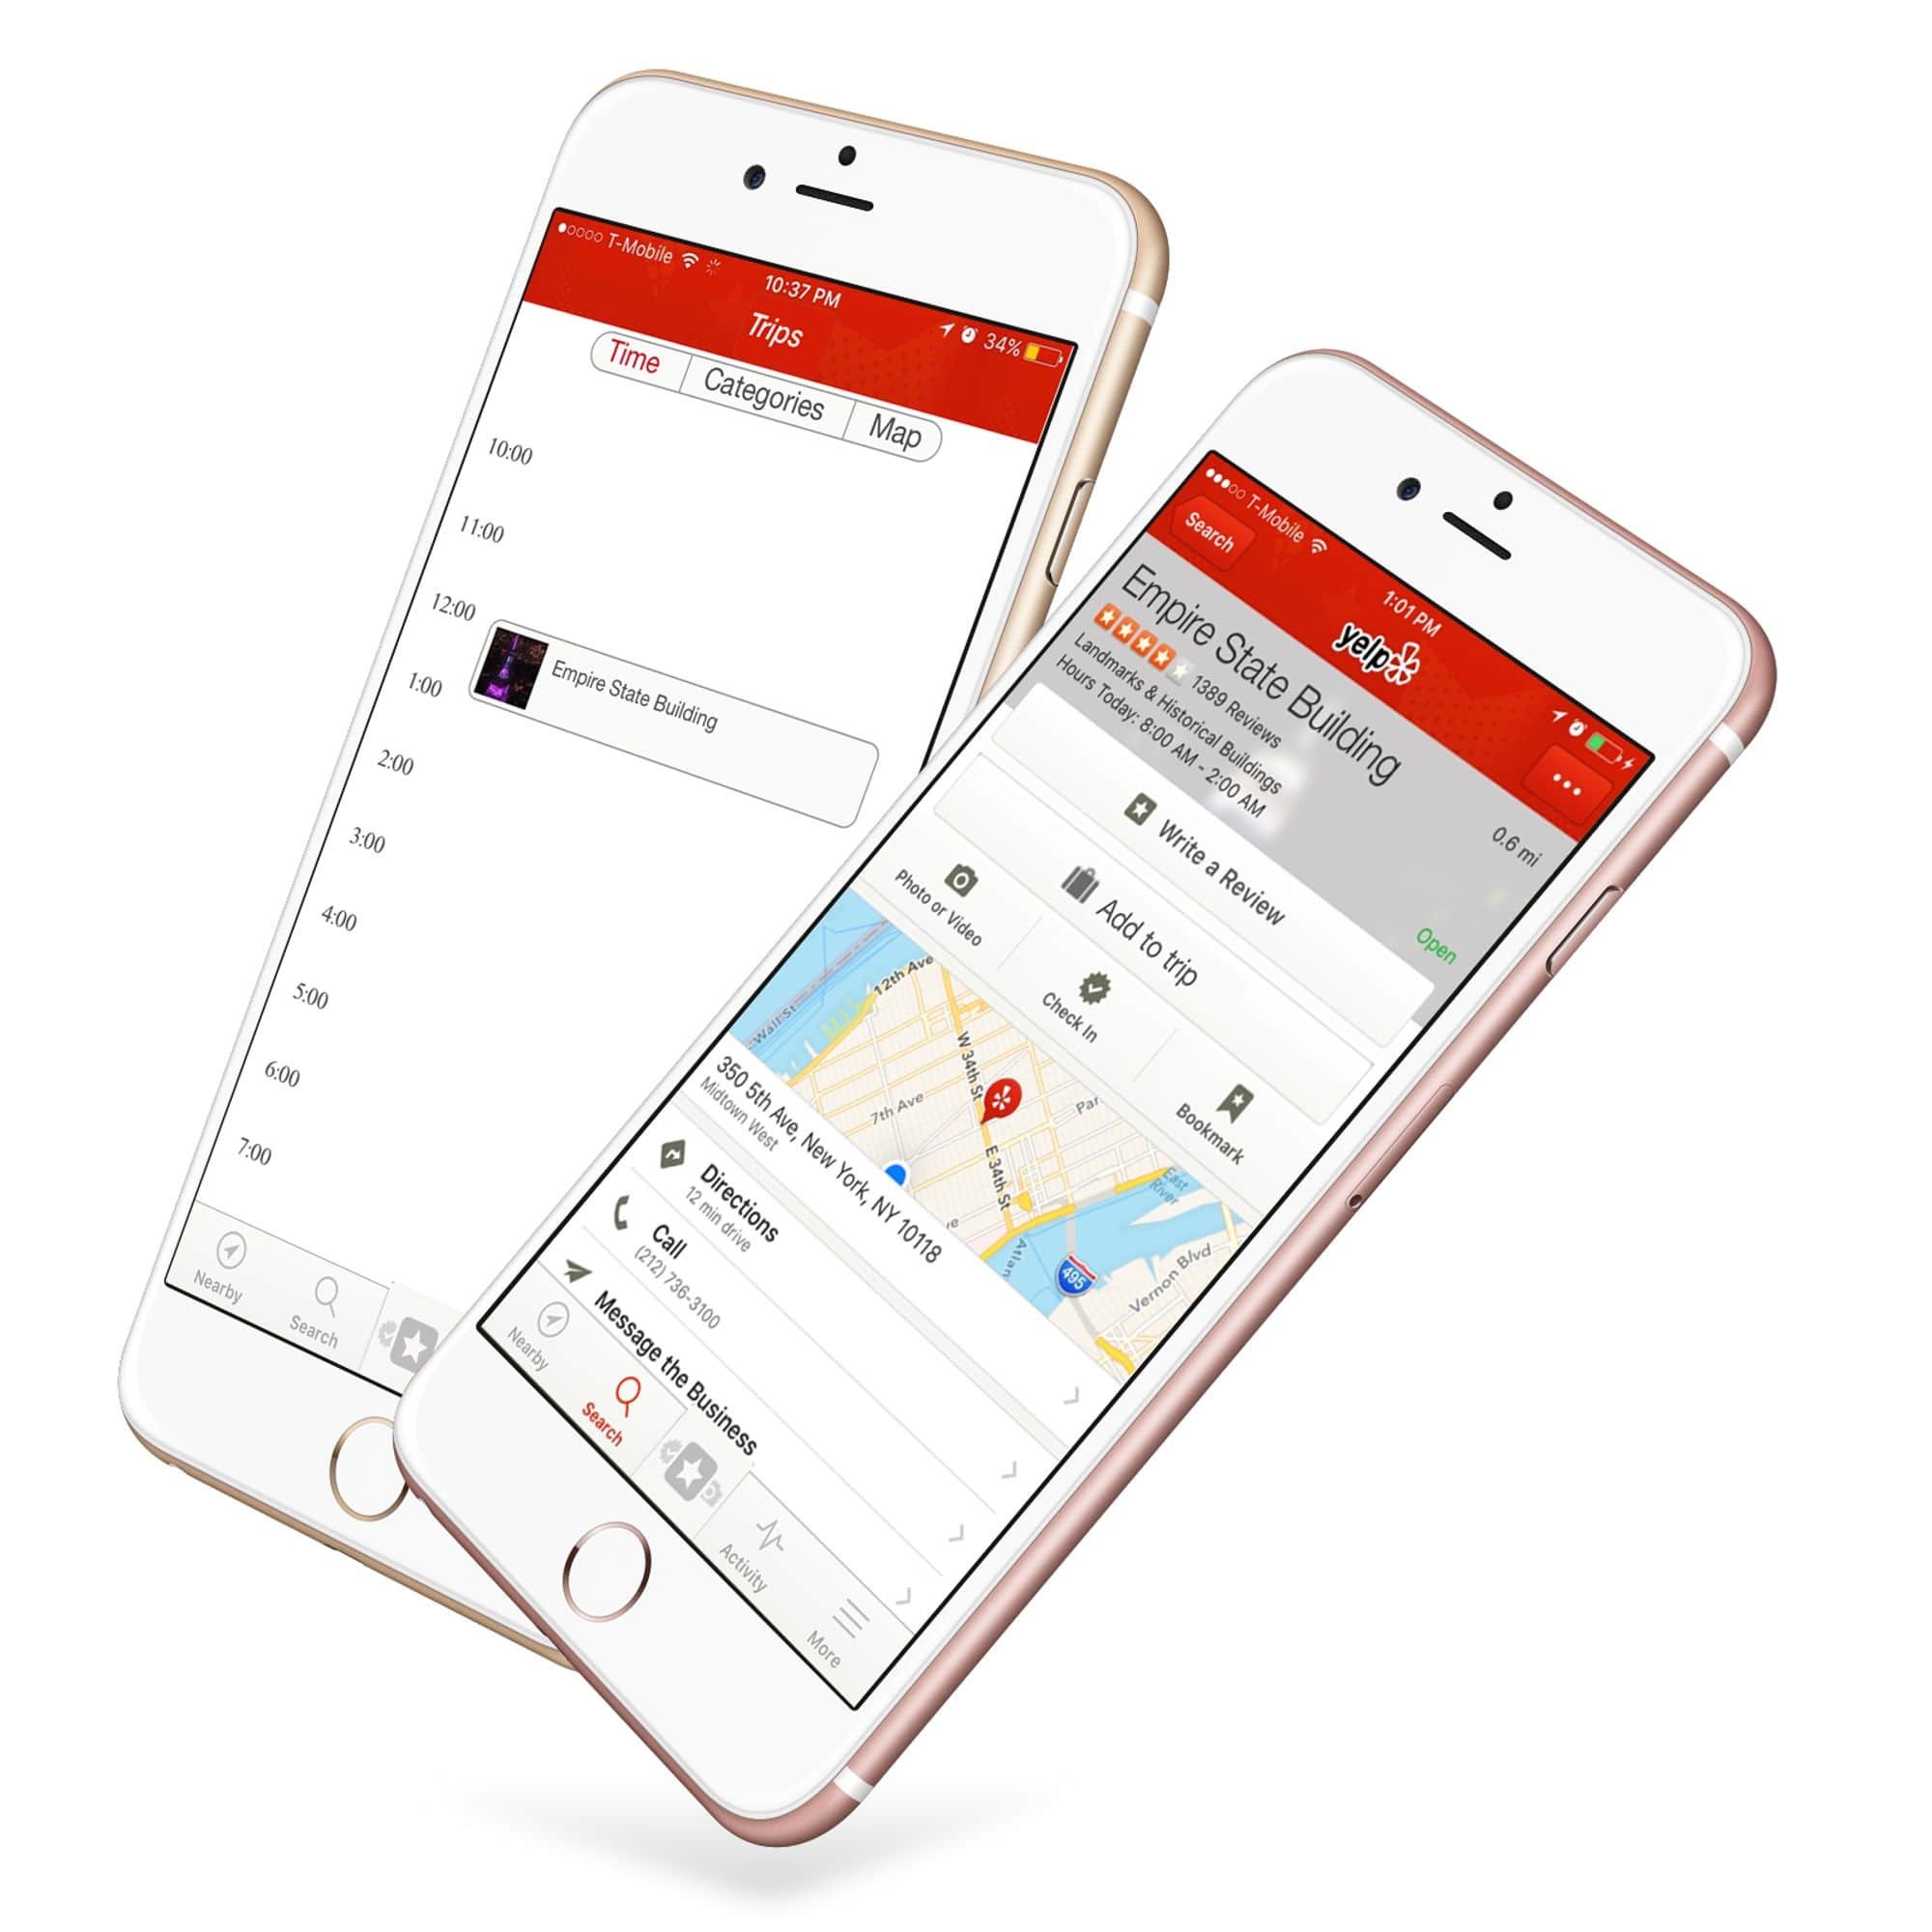
We had decided to create a companion app but we were worried about how it would fare in testing. We were in uncharted territories because, as a completely new app, users may not necessarily know how to navigate it. Because of this, we decided to rapidly prototype. Using Sketch, I composed a variety of screens for the initial version of our app, named Travels. To save time, I took icons from TheNounProject.com and used a map by Roberto Scandola.

Users can select a location on the map, read the details, and save it as a trip item to their trip.

Users can save journal entries and photos to an individual trip item.
Our initial design had a variety of screens, but had a global navbar as Yelp’s app did. The navbar contained each of the planning methods users had indicated a preference for, as well as a journal section to access their entries and a more bar.
Initial testing proved difficult. A lot of users did not understand what the icons did and were confused with the flow overall, although this could have been a result of unclear labels.
After a couple of unsuccessful rounds of testing we reevaluated the features and idea. We changed directions, reincorporating the trip feature back into the Yelp app and scrapping the companion app idea. Despite this large redesign, the flow remained mostly intact.
We reevaluated the companion app idea and realized it may be better to reincorporate it into Yelp. Despite the overstuffed app interface, the benefits outweighed the costs.
Another change that a group member suggested that made sense at the time but in retrospect seems again suboptimal was the removal of the journal section — we decided that Yelp’s request for users to be able to document their experiences would simply be the ability to post to the existing public location page from their personal itinerary page because that increases Yelp’s user engagement. I think however, that this defeats the purpose of users documenting their experiences, as they are simply documenting the location with no option to do so publicly or easily knowing other experientially-relevant data such as entry date and people. But that is something that could be later explored in the future.

Adding trip items remained an identical flow between the companion app and the Yelp app feature version.
Our next version is accessible via Yelp’s navbar’s center button, which hosts a variety of functions. Because of time limitations, our test mockups were not fully high-fidelity so a variety of small aesthetic problems existed that I have since fixed.

Users can add trip items directly from Yelp’s location pages.

With the journal feature removed, users adding photos from the Yelp button can see locations from their trips add photos to the pages.
Usability tests with this version returned promising results. Despite the Yelp app’s difficult navigation, once users found the feature, using it was quite simple. Since the flow was mostly unchanged, this suggests that the problem had been the visual design of the app rather than the flow.
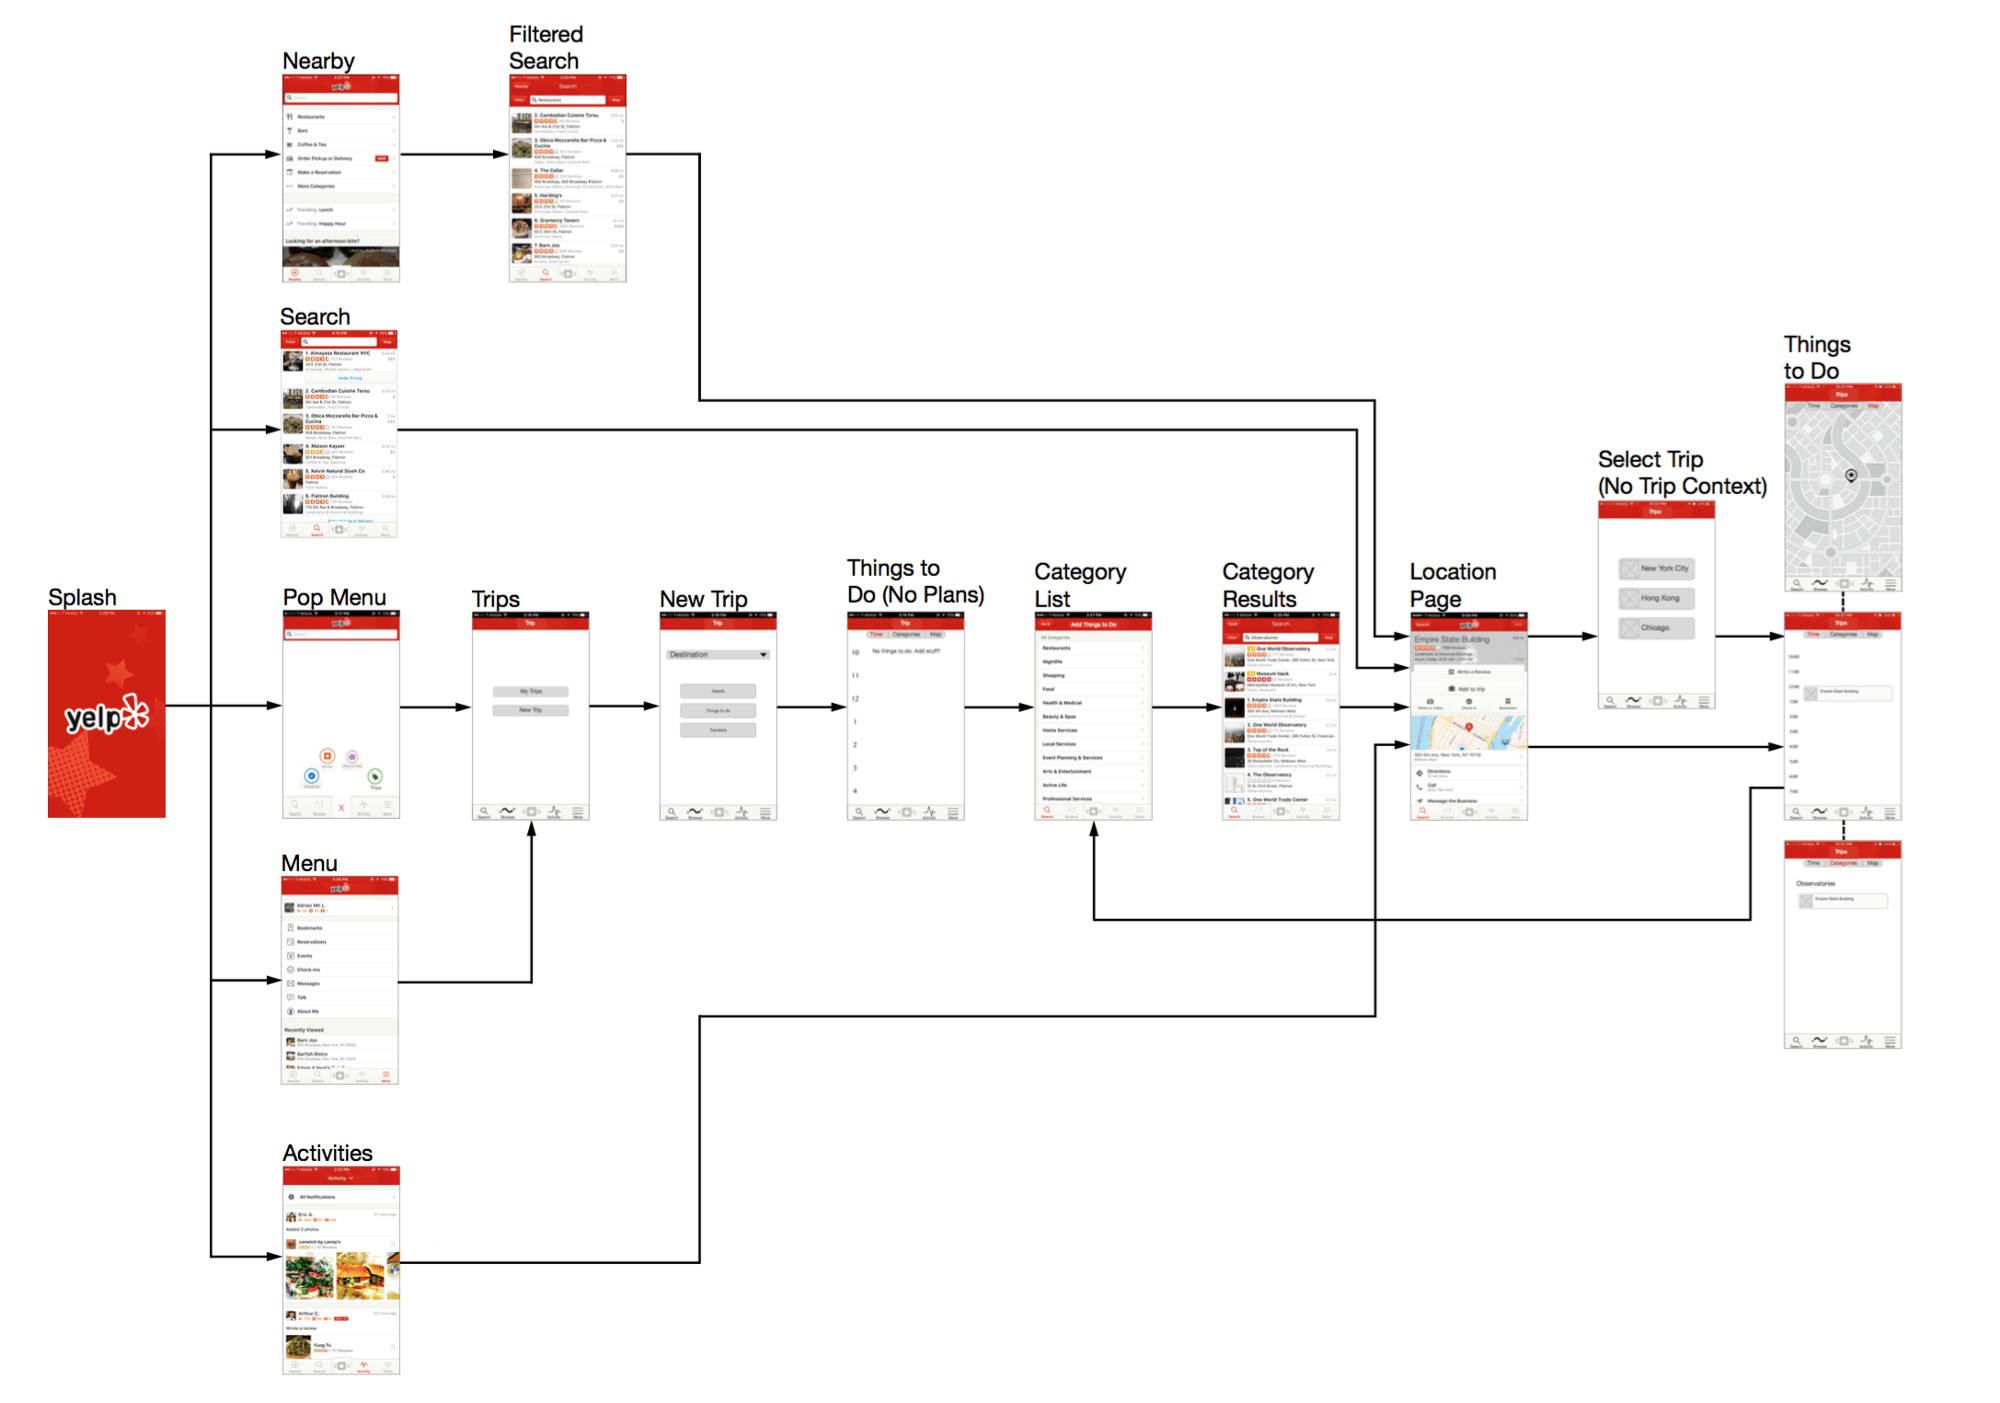
Like the app it’s in, our feature also features multiple paths to a single feature.
V. Deliver
As we finished up our prototype, we started the task of coordinating the client presentation. We found an empty room and ran through the presentation a couple of times, assigning slides and checking visibility and audibility. The presentation was in the morning and we would nail it.
Next Steps
The following morning the presentation practice paid off splendidly. However, there would be many areas I would like to improve if I had more time in the future.
Information Architecture
While testing our second version, many people had trouble locating our feature within the Yelp app as as we had noted before. In particular, using the Search function in Yelp presented users with a bewildering way of categories that almost certainly does not fit a majority of users’ mental taxonomy of locations. A further step therefore would be to diagnose and fix the information architecture of Yelp’s app so that it can be more intuitive.
Finishing Up Current Features
Because of the time constraints imposed by our redesign, a number of our features were not fully fleshed out and I would touch up a few of the designs both aesthetically and functionally.
The Journal Feature
The journal function was ditched, and in its place was the simple function to post photos to Yelp’s existing location pages from one’s personal trip event page. While we had agreed to this last-minute change (9pm before the final presentation the following morning), looking back it makes little sense now. This group member’s erstwhile argument had been that allowing users to post private journals was not conducive to increasing Yelp’s user engagement and its business goals. However, this line of logic seems similar to saying we shouldn’t have freemium business models because allowing users not to pay is not conducive to earning money. Yelp wanted to allow users to ‘document their experiences’ and somehow I think simply providing another method to post a photo of Macy’s to Macy’s page rather than one’s own plan is not how most users would like to document their travels.
Collaboration
A feature we had had in the first version but did not make it into the second version because of time constraints was a fuller collaboration system. This was an oft-mentioned pain point for our interviewees. While in our current app, it is possible to add travelers to a trip and see shared notes regarding various trip items, there isn’t real-time chatting or messaging, and a system of having one person be the lead organizer that would do the majority of planning could be explored further.
Aesthetics
Another problem that slipped by because of time constraints was simply the level of fidelity and completeness of the look and feel. A number of our mockups were of lower-than-optimal fidelity, and a few design elements were inconsistent throughout the design. These represented the finishing touches to our last minute redesign and should be easy to standardize.
Further Features
Further features we could explore would be the features from the should and could sections of the feature prioritization chart. Easy to implement features include:
An option for wifi-only synching
Toggling for measurement units (fahrenheit to celsius)
Synching events from the Google calendar
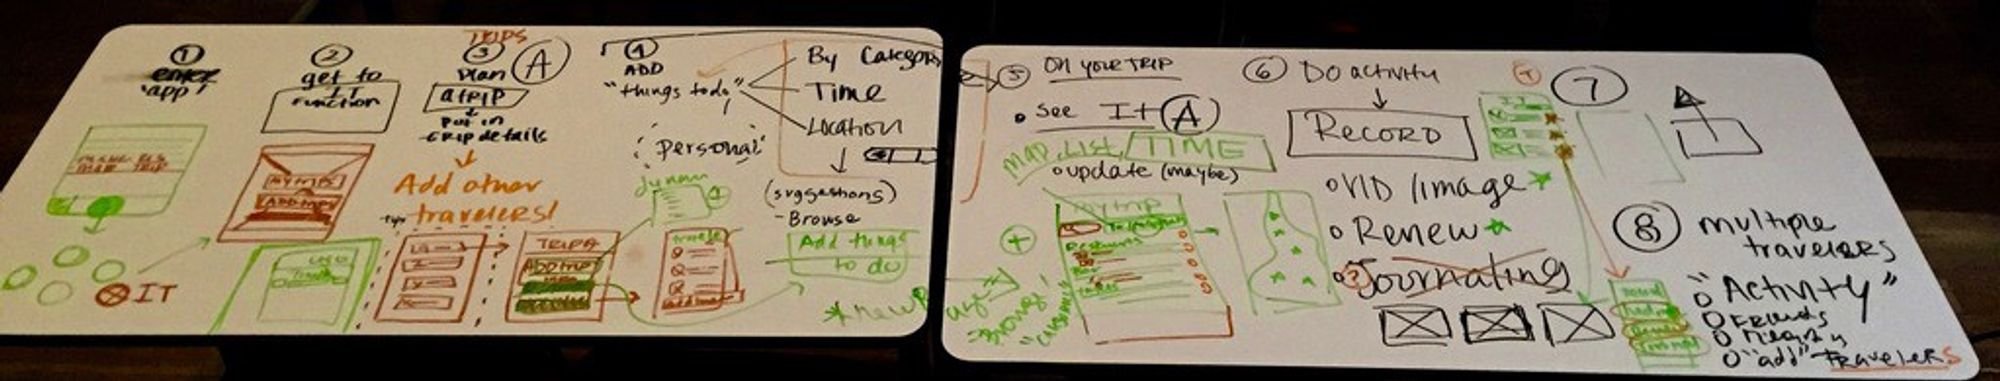
I have a newfound appreciation for whiteboard walls.
Self Reflection
This was my first group UX project and the main issue revolved around communication. I seemed to have very little communication problems with one of my group members shared web tech as our background. In addition we both communicated with quick sketches to illustrate our ideas, something the other group member rarely did, making it hard to understand the ideas this group member suggested.
Moving forward, I should be more insistent and expressive to have more visual communication and inform members so I can better understand ideas and make sure we are on the same page. After all, sketching narrows the gap between different members mental conceptualizations of the problems.
In addition, it was easy for me to create the organization system we used in this project, but it was a little harder to get members to fully use it correctly. There was a lot of uploading of documents into our Slack conversation which would then subsequently be lost in the conversation. In the future I would like to explore how to get people to use it more efficiently as a system is dependent on the motions of its parts.